

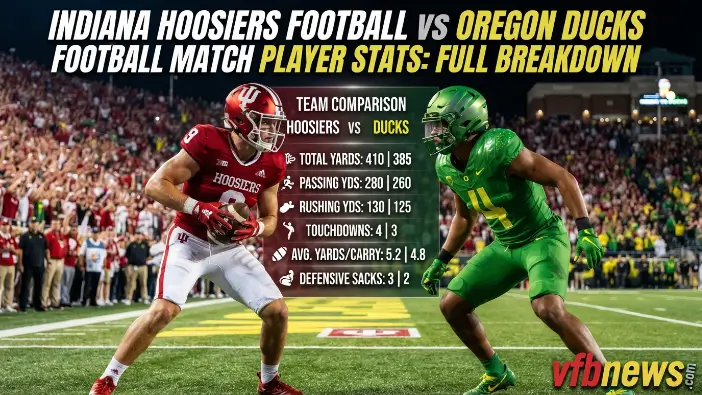
Welcome to VFB. The Indiana Hoosiers football vs. Oregon Ducks football match player stats highlight how Indiana turned a competitive matchup into a convincing 56–22 victory in the Peach Bowl on January 9, 2026. The Hoosiers came out strong, scored 21 points in the second quarter, and maintained control throughout the game, leaving Oregon with little chance to make a comeback.
The quarterback stats also stand out. Fernando Mendoza completed a strong performance with 177 passing yards and five touchdowns while avoiding any interceptions. Oregon’s Dante Moore recorded more passing yards with 285 and added two touchdowns. However, Indiana’s stronger rushing attack and ability to create turnovers made the biggest difference, as the Hoosiers won the turnover battle 3–0.
Indiana Hoosiers vs Oregon Ducks Match Result and Game Details
Indiana entered the Peach Bowl semifinal with a perfect 15–0 record, while Oregon came in at 13–2. The Hoosiers quickly took control, holding a 14–7 lead after the opening quarter before exploding for 21 points in the second quarter to take a commanding 35–7 advantage into halftime. Oregon managed to score 15 points in the second half, but Indiana continued to add to its total with 21 more points, securing a dominant 56–22 victory.
Final Score and Quarter-by-Quarter Breakdown
Indiana’s 21-point second quarter proved to be the turning point of the game. The Hoosiers found the end zone three times during the quarter, building a commanding 28-point advantage by halftime and putting themselves firmly in control of the matchup.
| Team | Q1 | Q2 | Q3 | Q4 | Final |
| Oregon Ducks | 7 | 0 | 8 | 7 | 22 |
| Indiana Hoosiers | 14 | 21 | 7 | 14 | 56 |
The final score also highlights a major difference in the team statistics. Oregon finished with more passing yards, recording 285 compared with Indiana’s 177. However, Indiana dominated on the ground with 185 rushing yards, while Oregon managed just 93. The Hoosiers also took better care of the ball, avoiding turnovers while Oregon gave it away three times.
Game Context
This game was a College Football Playoff semifinal at the Peach Bowl, rather than a regular-season matchup. It was also a rematch, with Indiana having previously defeated Oregon 30–20 on October 11, 2025.
The second meeting was far more one-sided. Indiana put up 56 points and took control early, maintaining its advantage for most of the game. Although Oregon moved the ball effectively through the passing game, turnovers and Indiana’s strong rushing performance made it difficult for the Ducks to keep pace.
Indiana Hoosiers vs Oregon Ducks Player Stats
The key Indiana vs. Oregon player stats cover passing, rushing, receiving, and defensive performance. Examining all of these numbers together provides a clearer understanding of how Indiana gained the advantage and ultimately secured the win.
Quarterback Passing Stats
| Player | Team | Completions | Attempts | Passing Yards | TDs | INTs |
| Fernando Mendoza | Indiana | 17 | 20 | 177 | 5 | 0 |
| Dante Moore | Oregon | 24 | 40 | 285 | 2 | 1 |
Fernando Mendoza delivered an efficient performance, completing 17 of 20 passes for 177 yards and five touchdowns without throwing an interception. Dante Moore recorded more passing yards, completing 24 of 40 attempts for 285 yards, two touchdowns, and one interception.
These numbers show why passing yardage alone does not tell the full story. Mendoza may have finished with fewer yards, but he produced more touchdowns and protected the football, making his performance more effective overall.
Leading Rushing Stats
Indiana had a strong advantage in the rushing game, with several players contributing on the ground. Kaelon Black led the Hoosiers with 63 rushing yards and two touchdowns. Roman Hemby added 53 yards, while Khobie Martin made an impact with 42 yards on just four carries.
| Player | Team | Carries | Rushing Yards | Yards/Carry | TDs | Long |
| Kaelon Black | Indiana | 12 | 63 | 5.3 | 2 | 23 |
| Roman Hemby | Indiana | 17 | 53 | 3.1 | 0 | 12 |
| Khobie Martin | Indiana | 4 | 42 | 10.5 | 0 | 26 |
| Dierre Hill Jr. | Oregon | 5 | 86 | 17.2 | 0 | 71 |
| Jay Harris | Oregon | 16 | 35 | 2.2 | 1 | 7 |
Dierre Hill Jr. led Oregon’s rushing attack with 86 yards, including an impressive 71-yard run. However, the Ducks finished with just 93 rushing yards as a team, well behind Indiana’s 185 yards on the ground. This significant difference in rushing production gave the Hoosiers a clear advantage and helped them control the game.
Leading Receiving Stats
Elijah Sarratt was Indiana’s leading receiver, recording seven catches for 75 yards and two touchdowns. Charlie Becker also made an impact, finishing with 48 receiving yards and one touchdown on just two receptions.
| Player | Team | Receptions | Receiving Yards | Average | TDs | Long |
| Elijah Sarratt | Indiana | 7 | 75 | 10.7 | 2 | 23 |
| Charlie Becker | Indiana | 2 | 48 | 24.0 | 1 | 36 |
| Jeremiah McClellan | Oregon | 5 | 64 | 12.8 | 0 | 43 |
| Jamari Johnson | Oregon | 4 | 83 | 20.8 | 1 | 39 |
For Oregon, Jamari Johnson led the receiving group with 83 yards and one touchdown. Jeremiah McClellan also contributed with 64 receiving yards on five catches. While Oregon produced some solid numbers through the air, Indiana was more effective at turning its offensive opportunities into points.
Read Also: Montana State Football: Schedule, Roster, History & 2026 Season Guide
Indiana Hoosiers Key Player Performances
Indiana’s 56-point performance was the result of a complete team effort on both offense and defense. Fernando Mendoza stood out as the leading offensive performer, while the running game, receiving corps, and defense each made valuable contributions. Together, these performances helped Indiana maintain control and turn the matchup into a convincing victory.
Fernando Mendoza Passing Performance
Fernando Mendoza completed 17 of 20 passes for 177 yards, five touchdowns, and no interceptions. His impressive 85% completion rate showed his accuracy and efficiency throughout the game.
Mendoza did not need to rack up a high number of passing yards because Indiana was highly effective in the scoring areas. His five touchdown passes and turnover-free performance were more valuable than simply accumulating passing yardage, helping the Hoosiers maintain control of the game.
Indiana’s Leading Rushers and Receivers
Kaelon Black led Indiana’s rushing attack with 63 yards and two touchdowns on 12 carries. Roman Hemby contributed 53 rushing yards, while Khobie Martin added 42 yards on just four carries. Their combined production helped Indiana finish with an impressive 185 rushing yards and maintain control on the ground.
Elijah Sarratt led Indiana’s receiving group with 75 yards and two touchdowns. Charlie Becker added 48 yards and a touchdown, while Omar Cooper Jr. contributed 17 yards and another score. With multiple players making plays in the passing game, Indiana was able to spread the scoring around and make its offense difficult for Oregon to contain.
Indiana Defensive Standouts
D’Angelo Ponds delivered one of the game’s biggest defensive plays by intercepting Dante Moore and returning the pick 25 yards for a touchdown. Aiden Fisher led Indiana with nine tackles, followed by Isaiah Jones with six, while Daniel Ndukwe added two sacks.
Indiana’s defense created three turnovers in total, including one interception and two fumble recoveries. Oregon was unable to intercept Fernando Mendoza and finished the game with three turnovers, giving the Hoosiers a major advantage in the turnover battle.
Oregon Ducks Key Player Performances
Oregon had several players who posted strong individual numbers, particularly in the passing and receiving game. However, their efforts were not enough to match Indiana’s scoring efficiency or overcome the Hoosiers’ advantage in creating turnovers.
Dante Moore Passing Performance
Dante Moore completed 24 of 40 passes for 285 yards and two touchdowns, but he also threw one interception. His passing total was 108 yards higher than Mendoza’s, showing that Oregon was able to move the ball effectively through the air.
However, Moore’s passing numbers did not tell the entire story. He also lost two fumbles, contributing to Oregon’s three total turnovers. These mistakes gave Indiana additional opportunities to score and made it much more difficult for the Ducks to stay competitive throughout the game.
Oregon’s Leading Rushers and Receivers
Dierre Hill Jr. was Oregon’s most explosive runner, finishing with 86 rushing yards on just five carries, including a 71-yard run. Jay Harris also contributed with 35 yards and a touchdown on 16 carries.
Jamari Johnson led Oregon’s receiving group with 83 yards and one touchdown, while Jeremiah McClellan added 64 yards on five receptions. Although Oregon showed the ability to make big plays, the Ducks struggled to consistently turn those opportunities into enough points to challenge Indiana.
Oregon Defensive Standouts
Bryce Boettcher led Oregon’s defense with 11 tackles, including seven solo stops. Dillon Thieneman followed with nine tackles, while Aaron Flowers recorded six tackles.
Oregon’s defense managed just one sack and could not intercept Fernando Mendoza. The biggest issue, however, was its inability to prevent Indiana from scoring. The Hoosiers put up 56 points, showing that Oregon’s strong individual tackle totals did not lead to enough defensive stops to keep the game competitive.
Indiana vs Oregon Team Statistics Comparison
The Indiana vs. Oregon team stats show that the game was about more than just total yardage. Indiana finished with 378 total yards, only 16 more than Oregon, but the Hoosiers had clear advantages in rushing, third-down efficiency, and protecting the football. These factors played a major role in Indiana’s dominant victory.
| Statistic | Indiana | Oregon |
| First Downs | 20 | 18 |
| Total Yards | 378 | 362 |
| Passing Yards | 177 | 285 |
| Rushing Yards | 185 | 93 |
| Yards per Rush | 4.6 | 3.6 |
| Third Down | 11/14 | 8/13 |
| Fourth Down | 0/0 | 0/2 |
| Turnovers | 0 | 3 |
| Penalties | 5–23 | 5–43 |
| Possession | 31:13 | 28:47 |
The biggest difference came in the rushing game. Indiana ran for 185 yards, nearly twice Oregon’s 93, giving the Hoosiers a clear advantage on the ground. That strong rushing performance helped Indiana sustain drives, control the clock, and maintain pressure on Oregon throughout the game.
Where Indiana Had the Biggest Statistical Advantage
Indiana’s biggest advantages came in the rushing game, third-down efficiency, and turnover battle. The Hoosiers recorded 185 rushing yards and converted 11 of 14 third-down opportunities, helping them sustain drives and keep their offense on the field.
Indiana also protected the football throughout the game, finishing with zero turnovers, while Oregon committed three. Those additional possessions gave the Hoosiers more opportunities to score and played a major role in their ability to maintain control from start to finish.
Where Oregon Had the Statistical Advantage
Oregon’s clearest advantage came through the passing game. The Ducks recorded 285 passing yards compared with Indiana’s 177, with Dante Moore making several big plays through the air.
Oregon also produced a few explosive rushing plays, including Dierre Hill Jr.’s impressive 71-yard run. However, those big plays were not enough to overcome the Ducks’ three turnovers or Indiana’s greater efficiency in turning offensive opportunities into points.
Biggest Takeaways From the Indiana vs Oregon Player Stats
The Indiana Hoosiers football vs. Oregon Ducks football match player stats highlight several key factors behind Indiana’s convincing 56–22 victory:
- Mendoza was more efficient. He threw five touchdown passes without an interception on just 20 attempts.
- Indiana dominated the rushing game. The Hoosiers recorded 185 rushing yards, compared with Oregon’s 93.
- Turnovers played a major role. Indiana finished with zero turnovers, while Oregon gave the ball away three times.
- Total yardage was not the deciding factor. Oregon finished just 16 yards behind Indiana in total offense, but the Hoosiers were much more effective at turning their opportunities into points.
Indiana vs Oregon Regular-Season Matchup Comparison
Indiana and Oregon had already met once during the 2025 regular season, with Indiana earning a 30–20 victory on October 11. However, the Peach Bowl rematch was a much more one-sided affair, as the Hoosiers dominated Oregon 56–22.
October 2025 vs January 2026 Player Stats
The two matchups featured some notable statistical differences. Indiana recorded more passing yards in the October meeting, while Oregon had the advantage through the air in the January rematch. Indiana also produced a much stronger rushing performance in the second game, making its ground attack a major factor in the 56–22 victory.
| Category | Regular Season | Peach Bowl |
| Indiana Score | 30 | 56 |
| Oregon Score | 20 | 22 |
| Indiana Passing | 215 | 177 |
| Oregon Passing | 186 | 285 |
| Indiana Rushing | 111 | 185 |
| Oregon Rushing | 81 | 93 |
The biggest improvement for Indiana came in its rushing production. The Hoosiers increased their rushing total from 111 yards in the October matchup to 185 yards in January. Their offensive output also surged, with Indiana scoring 56 points in the rematch compared with 30 in the first meeting.
What Changed Between the Two Matchups?
The October matchup was much more competitive, with Indiana earning a 30–20 victory after recording 326 total yards compared with Oregon’s 267. The Hoosiers also held the edge in rushing and turnovers, helping them secure the win in a closely contested game.
The January rematch was a completely different story. Indiana rushed for 185 yards, converted 11 of 14 third-down opportunities, and finished without a turnover, while Oregon committed three. Although Dante Moore threw for more yards than Fernando Mendoza, Indiana was far more efficient when it mattered, turning its opportunities into points and pulling away for a dominant victory.
Frequently Asked Questions
What was the biggest difference between the two teams?
Indiana was better at finishing drives and protecting the football. The Hoosiers turned their chances into points while Oregon struggled with turnovers.
Which team had the stronger rushing attack?
Indiana had the stronger overall rushing attack. The Hoosiers finished with 185 rushing yards, while Oregon had 93.
Did Oregon’s passing game perform well?
Yes. Oregon moved the ball well through the air and finished with more passing yards than Indiana. However, the Ducks could not turn that advantage into enough points.
Why was the game decided so early?
Indiana’s 21-point second quarter created a large halftime lead. Oregon entered the second half down 35–7, making a comeback very difficult.
What does the matchup show about football statistics?
The game shows that one statistic rarely tells the full story. Passing yards can look strong, but turnovers, rushing, third-down success, and scoring efficiency can have a bigger effect on the final result.
Conclusion
The Indiana Hoosiers football vs. Oregon Ducks football match player stats help explain why Indiana secured such a convincing victory. Fernando Mendoza delivered an efficient performance, throwing five touchdown passes without an interception. While Oregon quarterback Dante Moore recorded more passing yards, Indiana had the stronger overall balance. The Hoosiers rushed for 185 yards, converted 11 of 14 third-down opportunities, and committed no turnovers, while Oregon turned the ball over three times and gave Indiana additional scoring opportunities.
The game also demonstrated why total yardage does not always determine the outcome of a football matchup. Oregon finished with 362 total yards, just 16 fewer than Indiana, yet the Hoosiers still won 56–22. Indiana was simply more effective at making the most of its opportunities. A strong rushing attack, efficient offense, solid ball security, and timely defensive plays all contributed to the result. For anyone analyzing the Indiana vs. Oregon player stats, the key takeaway is straightforward: efficiency, ball security, and the ability to turn opportunities into points can be just as important as passing yards or total offense.
